
AI Detection and Response (AIDR) is the practice of continuously discovering, tracing, and detecting threats across every AI tool running on your endpoints — and the single most urgent capability gap in Australian enterprise security right now. Before anything else, instrument full end-to-end trace capture on your highest-risk AI deployment.
The core telemetry types you need from day one:
- User prompts and model responses (verbatim, not summarised)
- Tool calls and MCP events, including connection metadata
- Retrieval provenance (which documents, which vector store, which query)
- Permission context at the time of each inference run
Security-grade AI observability is not about model performance. It is about knowing exactly what your AI did, to what data, under whose authority, and whether it was told to do something it should not have.
Pro Tip: Start with the AI deployment that has the broadest access to regulated or sensitive data. That is your highest-risk pilot target, not the most technically interesting one.
Table of Contents
- What must an AI observability tool deliver for security teams?
- How does AIDR differ from traditional performance monitoring and EDR?
- How do you move from pilot to production?
- What telemetry fields does security-grade AI observability require?
- High-value detection use cases and how to map their severity
- How do SIEM, SOAR, EDR, and MDM fit into an AI observability workflow?
- Vendor evaluation checklist for AI observability tools
- Key takeaways
- The urgency Australian security teams are underestimating
- Alectura AIDR: built for the security team, not the data science team
- Useful sources and further reading
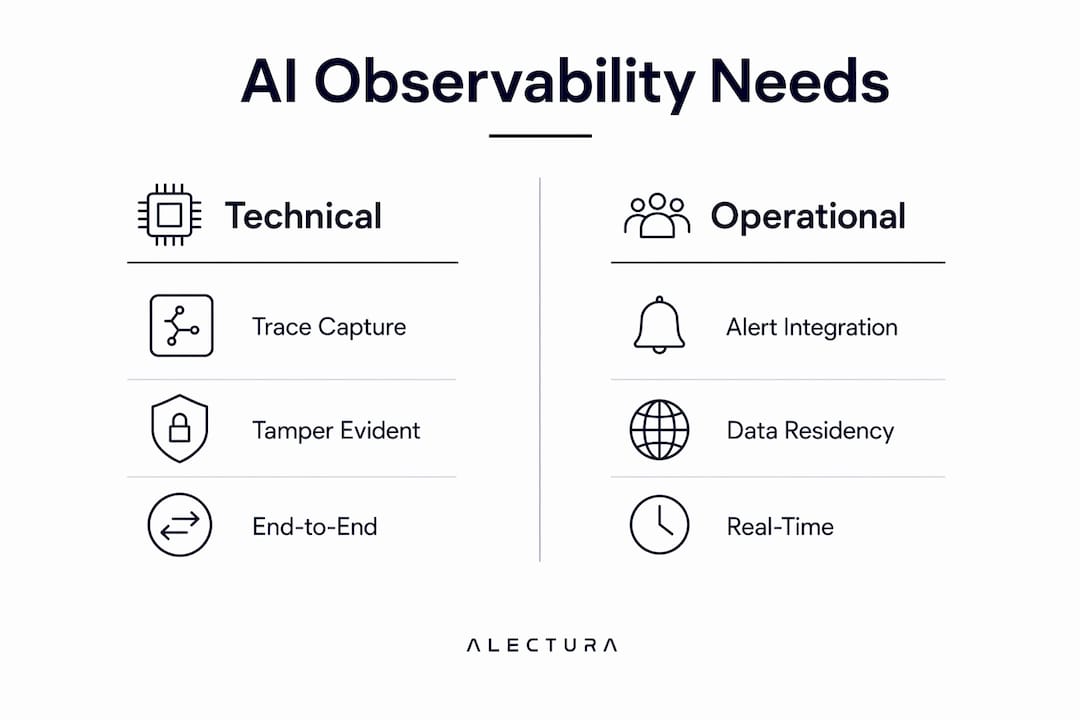
What must an AI observability tool deliver for security teams?
Discovery and inventory come first. Any tool that cannot find AI running on endpoints it was not told about is not a security tool — it is a performance dashboard. Automated AI-BOM generation and continuous shadow AI detection across your fleet are non-negotiable.
Beyond discovery, the capability checklist breaks into six areas:
- End-to-end tracing: Capture prompts, model responses, tool calls, retrieval provenance, and permission context as linked spans under a single trace ID per run.
- Adversarial detection: Real-time identification of prompt injection attempts, data exfiltration, and unauthorised MCP connections, with succumb/resist confirmation so you know whether the attack landed.
- Sensitive data monitoring: PII, PHI, and PAN detection across prompt and response content, with redaction options that do not break the audit trail.
- Integration hooks: Native connectors or webhook support for SIEM, SOAR, EDR, and MDM platforms so alerts flow into existing workflows.
- Policy enforcement: Guardrails that can block or redact at runtime, not just alert after the fact.
- Auditability: Immutable logs, configurable retention, role-based access, and data-residency controls that satisfy Australian regulatory expectations.
Pro Tip: Ask vendors whether their audit logs are tamper-evident. An alert you cannot prove in a post-incident review is worth very little to a regulator or an insurer.
How does AIDR differ from traditional performance monitoring and EDR?
Standard APM tools tell you an AI service returned 200 OK in 340ms. That tells you nothing about whether the model was manipulated, exfiltrated data, or called an MCP server it had no business touching. Application-layer semantics — what the model actually said and did — are invisible to HTTP-level health checks.

EDR closes the gap on the device layer but was designed for deterministic software. It can tell you a process ran; it cannot tell you what a language model decided, why it called a tool, or whether a retrieved document contained regulated data.
| Dimension | APM / EDR | AIDR |
|---|---|---|
| Primary signal | Latency, errors, process events | Prompts, responses, tool calls, MCP events |
| Threat model | Malware, exploits, misconfigurations | Prompt injection, agentic drift, data exfiltration via AI |
| Forensic unit | Log line, process tree | Full session trace with retrieval provenance |
| Detection approach | Static signatures, thresholds | Behavioural baselines, succumb/resist confirmation |
| Scope | OS and application layer | AI inference layer and agentic decision paths |
The forensic difference is the most consequential. True forensic reconstruction requires not just the model output but the retrieval provenance, tool invocation arguments, and the exact permissions in effect for that run — so analysts can distinguish an exploit from a legitimate error.
How do you move from pilot to production?
A phased roadmap keeps the project scoped and defensible to leadership.
- Pilot scoping (weeks 1–2): Choose one bounded use case with clear risk — a support copilot with access to customer records is a common starting point. Define the endpoints in scope, the threat scenarios to test, and the success criteria.
- Instrumentation (weeks 2–4): Deploy the agent or SDK. Align to OpenTelemetry GenAI semantic conventions so telemetry is consistent and portable. Enable prompt and response capture, configure MCP and tool-call tracing, and confirm trace IDs link spans end to end.
- Validation (weeks 4–6): Run controlled prompt injection and data exfiltration scenarios. Confirm forensic reconstruction works: can an analyst replay the session and identify exactly what happened? Use queryable trace datastores to test regression scenarios.
- Operationalisation (weeks 6–12): Wire alerts into SIEM and SOAR. Write runbooks for the top five detection scenarios. Set retention and access policies. Assign a privacy officer to sign off on data contracts before scaling.
- Scale (month 3 onwards): Expand to additional endpoint cohorts, add MDM integration for mobile AI tools, and tune alert thresholds based on pilot false-positive rates.
Typical roles: SOC analyst (alert triage), SRE (instrumentation and performance), privacy officer (data contracts and retention), endpoint admin (agent deployment and MDM).
Pro Tip: Self-hosted open-source options like Laminar can accelerate a privacy-constrained pilot — you keep telemetry on-premises while you negotiate data-residency terms with enterprise vendors.
What telemetry fields does security-grade AI observability require?
| Field | Purpose |
|---|---|
| Request ID / Trace ID | Links all spans in a single inference run for forensic reconstruction |
| Timestamp (UTC) | Establishes event ordering across distributed components |
| User identity | Ties model behaviour to an authenticated principal |
| Prompt text | Verbatim input; required to detect injection and policy violations |
| Model response | Verbatim output; required to detect exfiltration and hallucination |
| Retrieval provenance | Document IDs, chunk hashes, vector store name |
| Tool / MCP call details | Tool name, arguments, return value, connection endpoint |
| Permission context | Roles and scopes active at inference time |
| Model version | Required for regression analysis after model updates |
| Token counts | Cost attribution and anomaly detection on unusually long outputs |
Trace design matters as much as the fields themselves. Each run should produce ordered spans from prompt receipt through retrieval, tool calls, and final action — all linked by the same trace ID. A broken span chain means a broken forensic record.
On retention: encrypt telemetry at rest and in transit, apply role-based access so prompt content is not visible to everyone with dashboard access, and define data contracts before ingestion begins. For Australian organisations, the OAIC's Privacy Act obligations and ACSC's logging and incident response guidance both point toward demonstrable auditability and onshore data residency where regulated data is involved.
Prompt text is personal information under the Privacy Act 1988 if it contains or reveals details about an identifiable individual. Treat it accordingly from the moment it enters your telemetry pipeline.
High-value detection use cases and how to map their severity
- Prompt injection leading to unauthorised commands: Detect when model output contains shell commands, API calls, or data-transfer instructions not present in the system prompt. Severity: Critical. Immediate response: block output, isolate endpoint, raise SOAR ticket.
- PII retrieval from internal datasets: Alert when retrieval provenance includes documents tagged as regulated and the response contains matching PII patterns. Severity: High. Response: redact response, log retrieval path, notify privacy officer.
- Unauthorised MCP connection: Flag any MCP server connection not on the approved inventory. Severity: High. Response: terminate connection, quarantine endpoint via EDR, update AI-BOM.
- Agentic drift: Baseline normal skill and tool-call patterns per agent role. Alert when deviation exceeds threshold (e.g., an agent that normally calls a calendar API begins calling a file-transfer endpoint). Severity: Medium to High depending on data access.
Pro Tip: Map every detection rule to a specific data type or system it protects. Rules without a clear asset owner get deprioritised during triage — and that is where incidents slip through.
How do SIEM, SOAR, EDR, and MDM fit into an AI observability workflow?
The observability layer generates the signal; your existing stack acts on it. The integration checklist:
- SIEM: Forward structured alert events with trace ID, user identity, model version, and severity. Map fields to your SIEM's schema so correlation rules can join AI events with endpoint and network logs.
- SOAR: Build playbooks triggered by high-severity AIDR alerts. A typical MCP exfiltration playbook: detect unauthorised MCP connection → enrich with AI-BOM asset context → isolate device via EDR → open SOAR ticket with full trace attached.
- EDR: Use device isolation as the containment action for Critical and High alerts. Pass the trace ID so the EDR case file links back to the AI session record.
- MDM: Enforce approved AI tool lists on managed devices. Feed the AI-BOM into MDM policy so unapproved tools trigger a compliance flag before they can exfiltrate anything.
Alert fatigue is the fastest way to make an observability investment worthless. Enrich every alert with AI-BOM context and succumb/resist confirmation before it reaches the analyst queue — a raw prompt injection attempt that the model resisted is informational, not a 2 AM page.
Without mapping telemetry to business risk — internet exposure, access to regulated data, asset criticality — security teams will face alert fatigue and struggle to prioritise high-impact threats.
Vendor evaluation checklist for AI observability tools
Core questions for any vendor:
- Does the tool discover AI running on endpoints it was not pre-configured to find (shadow AI)?
- Does it capture full prompt and response text, or only metadata?
- Is telemetry schema compatible with OpenTelemetry and OpenInference conventions?
- Does it detect MCP connections and track tool-call arguments?
- What are the data-residency options? Can logs be stored in Australian regions or on-premises?
- What is the retention model and who controls encryption keys?
Scale and performance criteria:
- Maximum endpoints supported per deployment
- Ingestion throughput at peak AI usage
- Sampling strategy options (full capture vs. risk-based sampling)
- Multi-tenant support for managed service environments
Australian procurement deal-breakers:
- No onshore logging option for regulated data workloads
- Encryption keys held exclusively by the vendor with no customer key management
- No documented alignment with OAIC Privacy Act obligations or ACSC Essential Eight
- SLA that does not cover incident response support in AEST business hours
| Evaluation dimension | Minimum acceptable | Preferred |
|---|---|---|
| Discovery scope | Configured AI tools only | Continuous shadow AI detection, automated AI-BOM |
| Telemetry schema | Proprietary with export | OpenTelemetry / OpenInference native |
| MCP detection | Manual configuration | Automatic connection detection and trust-chain tracking |
| Data residency | Cloud region selection | Onshore Australian region or on-premises option |
| SIEM integration | Syslog / webhook | Native connector with field mapping |
Pro Tip: Ask for a live discovery demo on a test environment that includes at least one AI tool the vendor was not told about in advance. That single test tells you more than any feature sheet.
Key takeaways
Security teams that instrument full end-to-end AI trace capture, integrate alerts into SIEM and SOAR, and enforce data-residency controls will be positioned to detect and contain AI-layer threats before they become notifiable incidents.
| Point | Details |
|---|---|
| Pilot a high-risk use case first | Choose the AI deployment with the broadest access to regulated data as your first instrumentation target. |
| Capture full trace telemetry | Prompt text, model response, retrieval provenance, tool calls, and permission context are all required for forensic reconstruction. |
| Integrate into existing security stack | Wire AIDR alerts into SIEM and SOAR with trace IDs so AI events correlate with endpoint and network logs. |
| Enforce data-residency controls | Australian organisations should confirm onshore logging options and customer-controlled encryption keys before signing a vendor contract. |
| Alectura AIDR for enterprise endpoints | Alectura discovers shadow AI across your fleet, traces every prompt and MCP event, and integrates with your SIEM and SOAR from day one. |
The urgency Australian security teams are underestimating
The conversation in most Australian security teams right now is still framed around whether AI is a risk worth addressing formally. That framing is already out of date. Copilots are active on endpoints across every industry sector, many of them with read access to internal documents, customer records, and source code. The attack surface expanded before the controls existed.
What makes the Australian context distinct is the combination of Privacy Act obligations, ACSC's increasing specificity around logging and incident reconstruction, and the concentration of regulated data in sectors — financial services, healthcare, government — that have adopted AI tools fastest. An organisation that cannot reconstruct what an AI model did with a customer's health record during an incident is not just operationally blind; it is potentially non-compliant with notifiable data breach obligations.
The teams I see moving fastest are not waiting for a perfect vendor evaluation process. They are running a bounded pilot on their highest-risk AI deployment, capturing full traces, and learning what their AI is actually doing. The gap between what security leaders assume their AI tools are doing and what the telemetry reveals is, consistently, larger than expected.
Alectura AIDR: built for the security team, not the data science team

Alectura is purpose-built for exactly the scenario this article describes: AI running on enterprise endpoints, much of it invisible to your existing security stack, some of it touching data it probably should not. Alectura discovers every AI tool across your fleet, inventories the access each one holds, traces prompts and MCP events in real time, detects sensitive data leaving the organisation, and feeds structured alerts directly into your SIEM and SOAR. On-device audit logging means your forensic record stays intact even when network connectivity is interrupted.
For Australian organisations, Alectura's data-residency and retention controls are designed to meet OAIC and ACSC expectations. View Alectura's AIDR platform or check per-endpoint pricing to scope a pilot. Ask for a live discovery demo on your own environment — bring an AI tool the team has not formally approved, and see whether Alectura finds it.
Useful sources and further reading
Authoritative references cited in this article, organised by topic:
- Microsoft Security Blog — Observability for AI systems: The primary technical reference for telemetry schema, OpenTelemetry GenAI conventions, forensic reconstruction requirements, and the AIDR framing. Start here for instrumentation guidance. Read the post
- SISA PRISM Observe: Covers succumb/resist confirmation, sensitive data detection (PII/PHI/PAN), and agentic drift monitoring. Useful for teams building detection rules and alert taxonomies. PRISM Observe
- Orca Security — Secure AI: Covers automated AI-BOM generation, shadow AI discovery, and connecting data security posture to runtime behaviour for prioritisation. Orca Secure AI
- Arize AI: Trace datastores, span evaluation pipelines, and regression testing for agent deployments. Relevant for the validation phase of the pilot roadmap. Arize AI
- Laminar: Open-source, self-hostable agent observability with searchable transcripts and SQL access to telemetry. A practical option for privacy-constrained pilots. Laminar
- OAIC — Office of the Australian Information Commissioner: Primary authority on Privacy Act 1988 obligations, notifiable data breach scheme, and how AI-generated outputs interact with personal information. oaic.gov.au
- ACSC — Australian Cyber Security Centre: Essential Eight maturity model, logging and incident response guidance, and sector-specific advisories. Relevant for retention policy design and audit requirements. cyber.gov.au
- Continuous AI monitoring concepts: Background on anomaly detection and monitoring approaches for AI deployments. AI monitoring overview
For procurement: before signing any AI observability contract, confirm onshore Australian data-residency options, customer-controlled key management, and documented alignment with OAIC and ACSC expectations. Those three clauses will save significant remediation effort later.